 Mobarok Hossain
 April 25, 2024
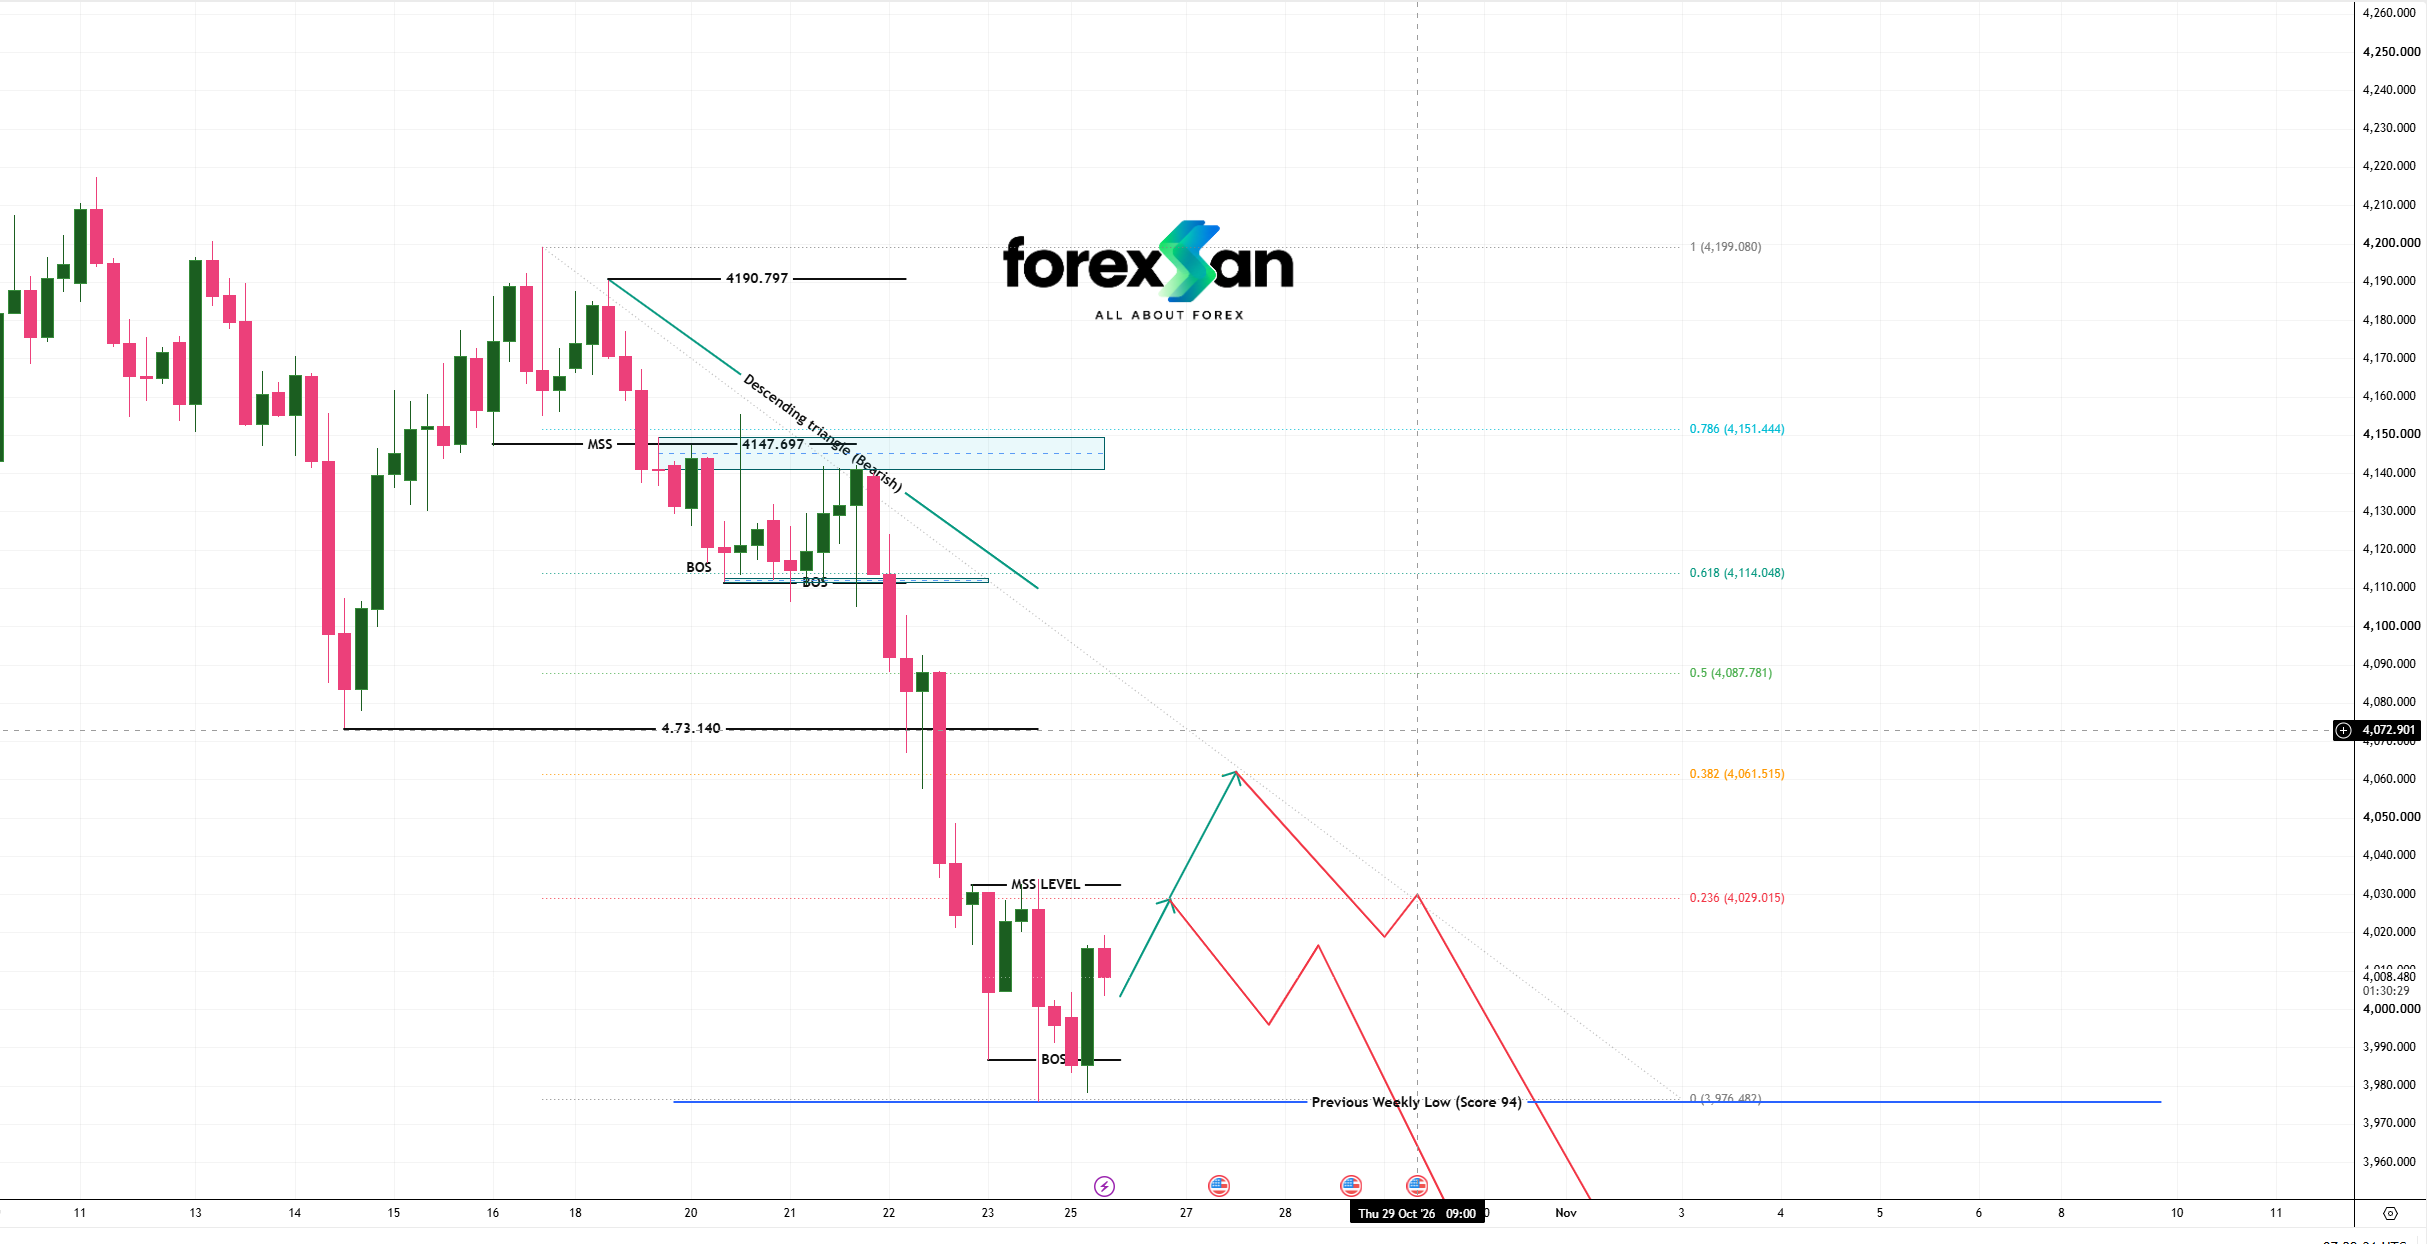
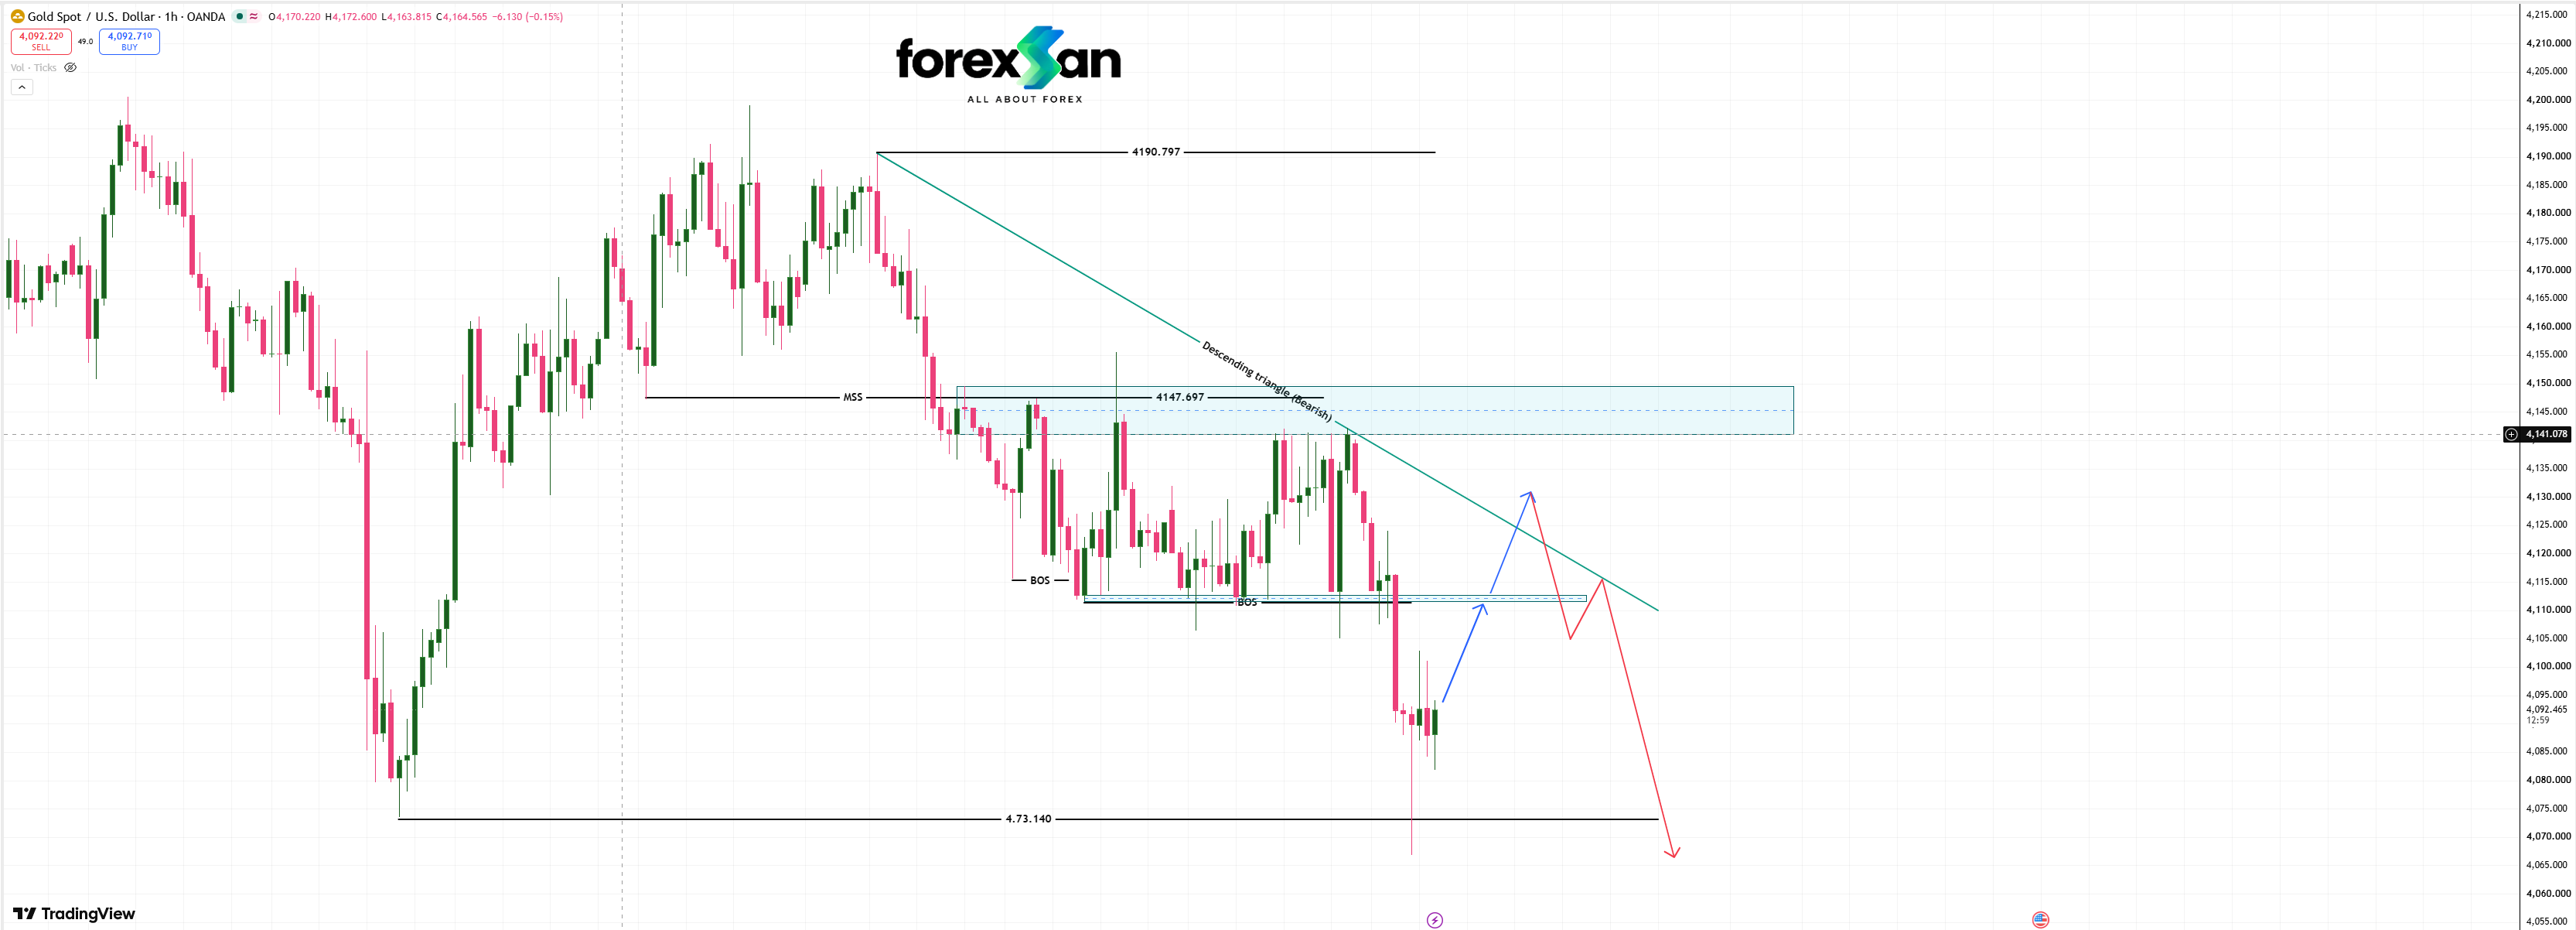
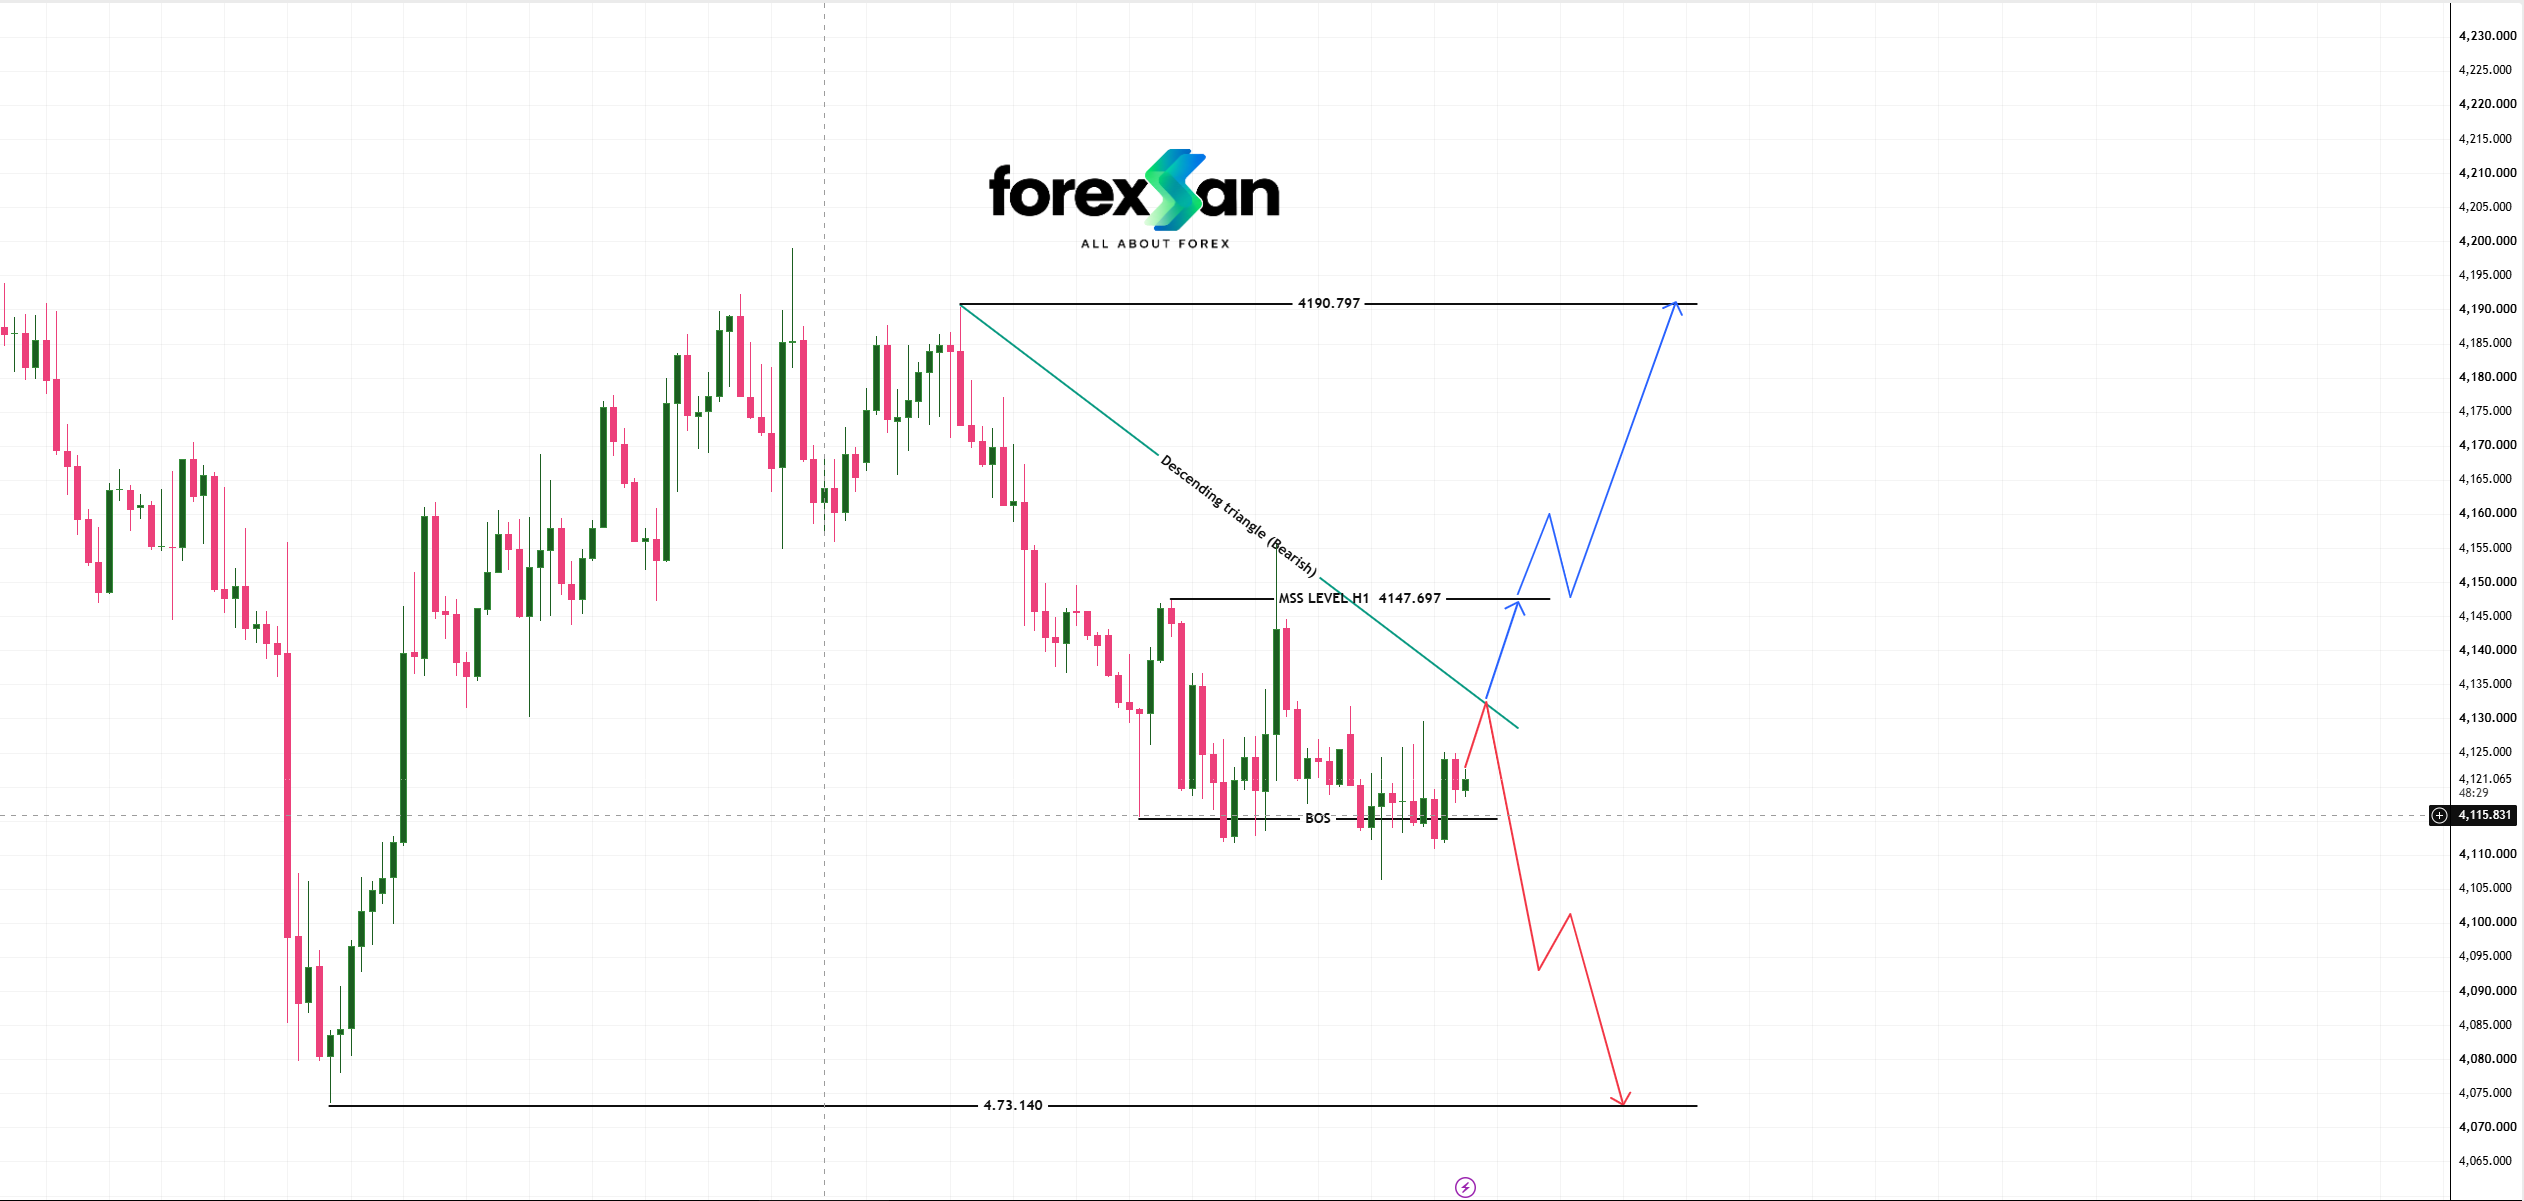
Spot Gold (XAU/USD) is consolidating within a **Descending Triangle** formation on the 1-hour timeframe. Price is compressing between lower horizontal support at **4,115.831** and descending trendline resistance. This structure sets up a dual-scenario framework depending on whether buyers can secure a Market Structure Shift (MSS) or if sellers force a breakdown.
### **Key Technical Levels**
* **H1 Market Structure Shift (MSS Level):** **4,147.697** — Critical pivot level for bullish validation.
* **Bullish Expansion Objective:** **4,190.797** — Major overhead liquidity target.
* **Horizontal Support Baseline (BOS):** **4,115.831** — Primary support floor.
* **Bearish Extension Target:** **4,073.140** — Key lower demand target following a breakdown.
---
### **Scenario Breakdown & Execution Strategy**
1. **Bullish Breakout Scenario (Target: 4,190.797):**
If buyers push price through the descending trendline and achieve a sustained candle close above **4,147.697 (MSS Level)**, the bearish pattern invalidates. A successful retest confirms a bullish expansion toward top-side liquidity at **4,190.797**.
2. **Bearish Continuation Scenario (Target: 4,073.140):**
If descending trendline resistance holds and price breaches the horizontal support floor at **4,115.831**, the descending triangle breakdown activates. Order flow favors a expansion down toward the lower structural demand zone at **4,073.140**.
---
*Disclaimer: This analysis is provided strictly for educational purposes and does not constitute financial or investment advice.*